

This value is traditionally used in statistics. You will say that it is usually calculated using a special calculator. And that is true. But it is important for us to learn how the computational process itself occurs, what stages it consists of, and what the logic of actions is. That’s what we will tell you about.
How to Interpret Standard Deviation?
We are dealing with a rather complex mathematical concept. But let us put it in simple terms. This is a measure of how much individual numbers in your dataset change. Perhaps you have heard another common term, “variance”?
So, all your calculations will be based on the value of the average number. It is key here. Then you need to find out to what extent certain data points deviate from the average number. Let us turn to a specific example right away.
You have to measure the height of five young trees in the garden. For instance, it will be 1.2 m, 1.3 m, 1.5 m, 0.9 m and 1.8 m. To begin with, we find the average height: (1.2+1.3+1.5+0.9+1.8)/5=1.34.
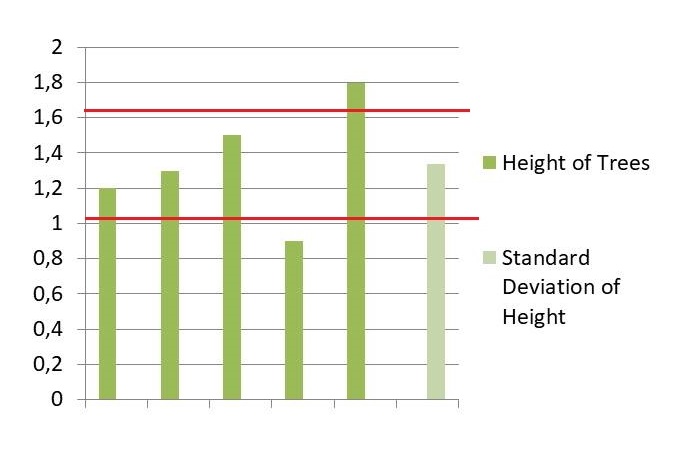
Next, you have to calculate the difference between each individual value and the average height. Accordingly, it is -0.14, -0.04, 0.16, 0.44 and 0.46. We square the difference value for each tree and find the average value for this data again. That is: ((-0,14)2+(-0,04)2+0,162+0,442+0,462)/5=(0,0196+0,0016+0,0256+0,1936+0,2116)/5= 0,452/5 = 0,0904. Thus, we obtained the value of the variance.
Then we just have to take the square root of this number. It turns out 0,0904≈0,3. Now we know the height of a tree within the deviation from the average value.
Mathematicians distinguish between high and low types of deviations. What does a high standard deviation mean? In practice, this means that there is a large difference between individual data points and the average value. And in the case of a low deviation, this difference is small.
Read more: How to Calculate Percentage Error?

Range of Standard Deviation
There is one general rule that helps us understand how scattered our number data is. This is the measure of variation.
All this is quite complex material for independent perception. The main thing concerning this theme is to practice and work out many tasks. Why not make your life easier and arrange private math lessons? With UpskillsTutor, finding a tutor becomes not only easy but also practical.
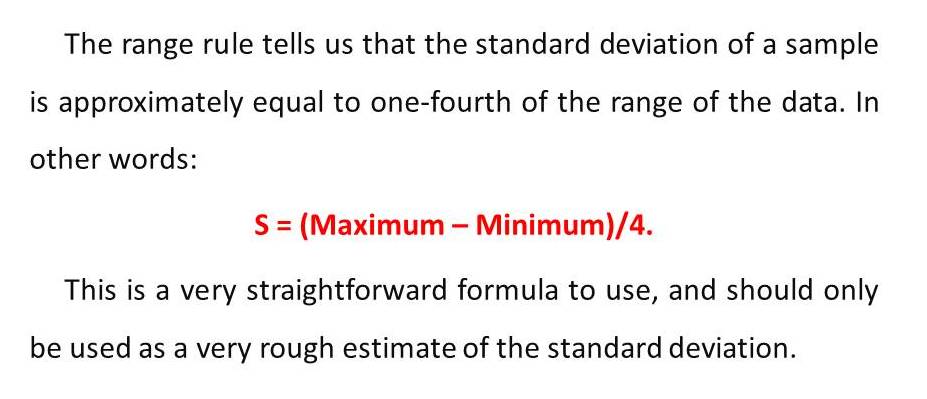
Another example of deviation in math. We have a series of numbers 8, 8, 10, 13, 14, 17, 17, 21, 21, 23. The average value is 15.2, and the deviation is 5.49. And now we move on to define the range: 23-8=15. According to the above formula, 15/4=3.75. In this way, we get an approximate estimate of the deviation, which allows us to evaluate the proposed statistics, as well as to find out the estimated sample size.
Read more: 8 Tips for Using the TI-84 Graphing Calculator on the SAT
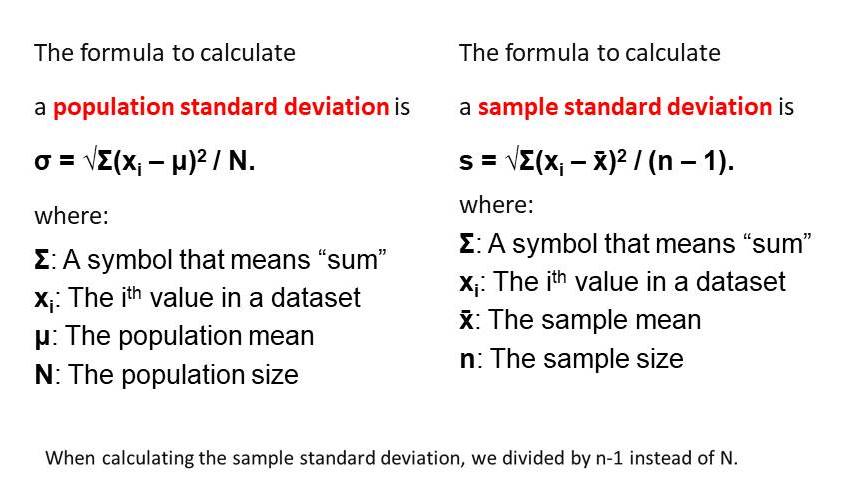
Population vs Sample Standard Deviation
When we work with all the data, that is, you need every value, it’s called “population”. When you use only a part, that is, a sample from a larger dataset, it is called a “sample”. With the formulas below, you can do without statistics, standard deviation calculator.
You can train in solving practical problems with a tutor and save a lot of mental effort. A teacher will determine your level and will select a suitable system of tasks.